Sea Level Rise Maps
California Sea Level Rise Maps
Los Angeles Sea Level Rise Maps
10 Feet (3 Meters). Interactive map showing the Los Angeles coastline under water as a result of a 10 foot rise of sea level.
Newport Beach Maps Showing Rise in Sea Levels
According to Gary
Griggs, director of the Institute of Marine Sciences at UC Santa Cruz,
although the rise in sea levels will occur gradually, vulnerable cities like Newport Beach and San Francisco will be among those impacted first by
large wave events and storm surges.
1 Foot (0.3 Meters). Map showing those approximate areas of Newport Beach that would be under water with a 1 foot rise in sea level. The National Research Council projects that sea levels along the Southern California coast will rise up to one foot (2 inches - 12 inches) by the year 2030.
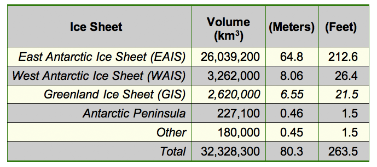
7Meters (23 Feet). Newport Beach landmarks at risk include the Balboa Pavilion, Newport Beach’s oldest standing building and one of its most famous landmarks. Submerged under water at 7 meters - roughly the equivalent of the sea level rise resulting from the melting of the Greenland Ice Sheet (see table at right).
How will global warming sea rise changes impact Sacramento? What will Sacramento look like? What happens to the map of Sacramento if sea level rises by 2 metres? 7 meters? 9 meters? 80 meters?
6.6 Feet (2 Meters). Map of Sacramento under a sea level rise level of 2 meters.
23 Feet (7 Meters). Consequences of a 23 foot (7 meter) rise in sea level for the Sacramento area. Showing the effect of a 20 foot rise in sea level. The Greenland ice sheet contains enough water to raise the sea level by 23 feet if all of it were to melt, according to Bill Krabill, a scientist conducting Arctic ice mapping research at NASA's Wallops Island Flight Facility (WIFF).
29.5 Feet (9 Meters). Sea level rise map of the city of Sacramento, California flooded to almost 30 feet.
Santa Monica Rising Sea Level Maps
197 Feet (60 Meters). Map
of Santa Monica flooded at almost 200 feet. Melting all Antarctica ice
would cause a global sea level rise of about 240 feet (USGS). Coastal
inundation mapping.
Ventura County Sea Level Rise Maps
13 Feet (4 Meters). Map of the Oxnard Plain coastline of Ventura County, California flooded at 4 meters (13 feet). Firetree.net using NASA data.
A 13 foot sea level rise is projected to occur if the West Antarctic
ice sheet collapses according to the Canadian Centre for Climate
Modelling and Analysis (an Environment Canada research lab at the
University of Victoria) and the University of Calgary, Nature Geoscience, January 9, 2011.
2 Feet. Sea level rise projected for 2040.
Coastline of the Oxnard Plain. Projected 2 foot ocean rise map.
Maurice D. Van Arsdol, Jr., Douglas J. Sharman, Angela Constable,
Jinkang Wang, and Louise Rollin, "Impacts of Global Sea Level Rise on California Coastal Population Resources,” Basia Zaba and John Clarke, eds., Environment and Population,
CICRED - Committee for International Cooperation in National Research
in Demography, Paris, 1995, pp. 413-430. See map on p. 425.

Enhanced risk zone (gray shaded area) from 2 foot sea level rise projected for the year 2040 along the California coastline of Ventura County Oxnard basin area. Van Arsdol et al, p. 425.
Florida Sea Level Rise
If the West Antarctic Ice Sheet (WAIS) melted, what would Florida look like?
What would Florida look like if the oceans rise up 10 feet?
Florida Sea Level Rise of 5 Meters (17 Feet)

What happens if sea levels rise 5 meters? Here is a coastal inundation mapping image created by William Haxby of the Lamont-Doherty Earth Observatory at Columbia University showing Florida climate change impacts under a 5 meter (17 foot) sea level rise. Source: NASA Earth Observatory, Goddard Space Flight Center, Greenbelt, Maryland.
East Coast of USA Sea Level Rise Maps
East Coast sea level rise maps. Showing sea level rise created for "An End to Global Warming." Zero meter rise. 1 meter rise. 3 meter rise. 10 meter rise. 30 meter rise. 100 meter rise. Dave Pape, Department of Media Study at the University at Buffalo, April 13, 2005.
Maryland Sea Level Rise Maps
2025. Sea levels forecast to rise up to 10 inches by 2025 based on a 3 degree Fahrenheit rise in ocean temperatures.
“As global temperatures rise because of the greenhouse effect, oceans
levels expand by the warmer water temperatures and because of the
glacial melting, according to John S. Hoffman, director of EPA's Strategic Studies staff, which conducted [the Sea Level Rise Project].
The study provided two scenarios on the possible effects over the next
40 to 100 years. The low scenario, based on on the calculated
three-degree rise in ocean temperatures, will make the seas rise . . .
up to 10 inches by 2025. Such an increase by 2025 would be enough to
'significantly increase (storm and erosion) hazards at places like Ocean City [Maryland].' Hoffman said. . .
For barrier islands like Ocean City, according to Stephen P. Leatherman,
a University of Maryland coastal geographer who participated in the
research, the results would differ, depending on the scenario. 'Even
the rate of sea level rise in the low scenario would mean erosion
problems two or three times worse than what they (Ocean City) are
seeing now, and the high scenario would be almost catastrophic — at
least a major, major increase in storm hazards, there,' he said. One
big problem cited by Hoffman is that around the United States there are
already 1,137 active hazardous-waste disposal sites located in 100-year
floodplains, areas where major innundations should occur at least once
a century.” Climate change 2025. (Associated Press, "Greenhouse effect' may harm bay water,"
Frederick News-Post, Frederick, Maryland, May 2, 1983, p. 13)
2025. Maryland shoreline in Somerset County projected to be eroded back 17 feet with a 2 inch sea level rise by 2025. “In August [2008], consultants with URS Inc. presented a draft report [Somerset County, Maryland : Rising sea level guidance] on sea level rise to the Somerset County
Planning and Zoning Commission. They predicted that by 2025 the
shoreline will be eroded back some 17 feet across the board [with a sea
level rise of 2 inches or 53 mm], increasing to 42 feet by 2050 and 92
feet by 2100. The greatest impact will be in the Deal Island and Chance communities, while Smith Island for the most part will be underwater just 90 years [2098 or ca. 2100] from now. . . .
The URS consultants are basing their report on historical data by
predicting a 2 inch increase in average sea level by 2025, 5 inches by
2050 and one foot by 2100. [Somerset County Technical and Community
Services Director Jack Willing Jr. ] said the state [of Maryland] is
forecasting a two to three foot rise with four feet ‘the worst case
scenario.’ He asked the consultants to modify their report
accordingly. Kyle Gulbronson, the senior planner and project manager
with URS, said four feet ‘is a doomsday scenario’ for much of the
county. The effects "will be dramatic," he said.” (Richard Crumbacker, Crisfield Times, “Storm gives look into the future - Consultants predicted vulnerable areas, and high tide showed it,” Crisfield Times, Crisfield, Maryland, September 10, 2008, pp. 1, 3 reporting findings in URS & RCQuinn Consulting, Inc., "Somerset County, Maryland : Rising sea level guidance,"
a report to the Maryland Coastal Zone Management Program, Department of
Natural Resources pursuant to NOAA Award No. NA05NOS4191142, September
24, 2008, p. 14)

North America Sea Level Rise Maps
60 Meters (197 Feet). Map of North America flooded to 60 meters. Global flooding. The Nexial Institute, 2002
North Carolina Rising Sea Levels Maps

3.5 Meters (11.5 Feet). Map of North Carolina lands close to sea level.
Source: James G. Titus and Charlie Richman, "Maps of Lands Vulnerable to Sea Level Rise: Modeled Elevations along the U.S. Atlantic and Gulf Coasts," U.S. Environmental Protection Agency, Washington DC, p. 18 originally published in Climate Research, November 2, 2001, p. 218)
Texas Sea Level Rise Maps
Galveston Sea Level Rise Maps
What would Texas look like if all ice caps melted?
Potential Global Sea Level Rise
Source: Adapted from Poore, Williams and Tracey cited in E. Lynn Usery, Modeling Sea-Level Rise Effects on Population Using Global Elevation and Land-Cover Data, AAG Meeting, April 2007. What is the worst case scenario for rising sea levels? What would maps look like if all ice caps melted?
Sea Level Rise Maps - (Meters) World Map
1 Meter to 6 Meters • 5 Feet = 1.5 Meters
See Center for Remote Sensing of Ice Sheets (CReSIS) ESRI ArcMap Global inundation analysis. David Braaten, Nathaniel Haas, Kolonie Hulbutta, John Kostelnick, Xingong Li, Joshua Meisel and Rex Rowley.
Africa Sea Level Rise Maps
Climate change vulnerability in Africa, Anna Ballance, UNEP/GRID-Arendal, 2002
African cities at risk to rising sea levels, Coastal Analysis Data Set utilizing GRUMP beta population and land area grids, Center for International Earth Science Information Network, CIESIN, Earth Institute, Columbia University, 2005
Alexandria, Egypt Sea Level Rise Maps
1 Meter (3.28 Feet) sea level rise. Alexandria, Egypt. Map of the city of Alexandria and the Nile Delta, Egypt flooded at a sea level rise of 1 meter. Potential impact of sea level rise: Nile Delta, UNEP/GRID Geneva; Prof. G. Sestini, Florence; Remote Sensing Center, Cairo; DIERCKE Weltwirtschaftsatlas, 2000.
7 Meters (23 Feet) sea leve rise. Map of the city of Alexandria, Egypt and Cairo area flooded at a sea level rise of 7 meters. Firetree.net using NASA data.
Lagos, Nigeria Sea Level Rise Maps
Lagos, Nigeria sea level rise map videos (1 meter to 60 meters, .
Lagos, Nigeria - Rising Sea Levels
Video showing rising sea levels in Lagos, Nigeria for zero meters, 1 meter, 2 meters, 3 meters, 4 meters, 5 meters, 6 meters, 7 meters, 8 meters, 9 meters, 10 meters, 11 meters, 12 meters, 13 meters (1 degree C), 20 meters (1.5 degrees C), 30 meters (2.5 degrees C), 40 meters (4 degrees C), 50 meters (5 degrees C), and 60 meters. Source: Carbon Virgin.
Asia Sea Level Rise Maps
60 Meters (197 Feet). Map of Asia and Australia flooded to 60 meters. The Nexial Institute. 2002
Australia Sea Level Rise Maps
60 Meters (197 Feet). Map of Asia and Australia flooded to 60 meters. The Nexial Institute. 2002
Bangladesh Sea Level Rise Maps
Europe Sea Level Rise Maps
60 Meters (197 Feet). Map of Europe flooded to 60 meters. The Nexial Institute. 2002
100 Meters (328 Feet). Map of Europe Flooded to 100 Meters. The Nexial Institute. 2002
Scotland Projected Coastline Map With Global Warming
Dunbar Scotland
20 meters (65.6 feet). Map of Dunbar, Scotland impacted by 20 meter rising sea levels.
Sea Level Rise Impacts of Arctic and Antarctic Melting
___________________________________________________
We have
already reached a tipping point where we will soon see an ice-free
Arctic Ocean in the summer.
There's nothing we can do about
that. It could be in 2015. It could be in 2025. It almost doesn't
matter. It'll happen in this generation.
As a result, the whole weather system could
change. (1)
Director, International Polar Year
July 2009
___________________________________________________
2050 | Rising Sea Levels
2050. Several feet. Sea level projected to rise several feet by the year 2050. “Whether the greenhouse effect has arrived or not, some scientists calculate that global temperatures could increase between 3 degrees and 9 degrees F by the year 2050. If that happens, even hotter, dryer summers are on the way, probably accompanied by a gradual melting of polar ice caps and glaciers that will cause sea levels to rise several feet by mid-century. By then it is probable that more CO2 production, from sources as diverse as industry and rampant deforestation, will play an increasingly important role in heating up the earth.” (David Brand, Andrea Dorfman-New York and Dick Thompson-Washington, “Is The Earth Warming Up?,” Time Magazine, Monday, July 4, 1988)
2050. Rising sea levels projected to inundate coastlines where millions
live. "Although scientists argue over whether the greenhouse
has already arrived, there is no dispute that industrial emissions will
cause global warming. The chief culprits are carbon dioxide (CO2),
emitted when such fossil fuels as coal and oil burn, and chemicals
called CFC's used in plastic foams and air conditioning. These
'greenhouse gases' act like panes of glass, trapping heat near the
surface of the earth. The result: global temperatures are expected to
rise 2 to 9 degrees Fahrenheit by the middle of the next century. There
would be greater increases at higher latitudes, smaller rises near the
equator. Wind and rainfall patterns would shift, with possibly
disastrous consequences for agriculture. Sea levels would rise,
inundating coastlines where millions of people live. Droughts would get
worse and storms more violent." (Newsweek, May 22, 1989, p. 80)
2100 | Global Warming Sea Level
2100 (1.5 to 7 feet). Global warming projected to cause 1.5 – 7 feet sea level rise by 2100. “Published estimates of sea level rise due to global warming generally range from 0.5 to 2.0 meters (1.5 to 7 feet) by 2100.” (U.S. EPA, The Potential Effects of Global Climate Change on the United States, EPA-230-05-89-050, Office of Policy, Planning and Evaluation, U.S. Environmental Protection Agency, Washington, DC, December 1989, p. xxxvi)
_________________________________________________________
2000 | 2010 | 2013 | 2015 | 2020 | 2025 | 2030 | 2035 |2040 | 2050 | 2060 | 2070 | 2080 | 2085 | 2090 | 2100
Arctic Climate Change | Forest Fire Global Warming | Global Warming Cost | Kilimanjaro Melting Glaciers | Heat Waves Climate Change | Energy Workforce Shortages | Water Scarcity
Global Warming Underestimated | China Global Warming | Climate Refugees | Permafrost | Sea Level Rise | Rise in Sea Level Maps | Global Warming Deaths