Global Warming Underestimated
___________________________________________________
You leave yourself an enormous margin of safety. You build a bridge that 30,000-pound trucks can go across and then you drive 10,000-pound trucks across it. That is the way I like to go across bridges. (1)
On estimating risks and margins of safety
___________________________________________________
Agricultural Impacts Underestimated
Crop yields projected to decline much sooner than expected as result of climate change. “Results from a new study [A meta-analysis of crop yield under climate change and adaptation," published March 16, 2014 by the journal Nature Climate Change], show global warming of only 2 degrees Celsius will be detrimental to three essential food crops [rice, corn/maize and wheat] in temperate and tropical regions. And beginning in the 2030s, yields from those crops will start to decline significantly. … [T]he study was able to create the largest dataset to date on crop responses, with more than double the number of studies that were available for researchers to analyze for the previous IPCC Assessment Report in 2007 [IPCC 4th Assessment Report].
…'Our research shows that crop yields will be negatively affected by climate change much earlier than expected,' said Andy Challinor, University of Leeds professor and lead author of the study. ‘Furthermore, the impact of climate change on crops will vary both from year to year and from place to place – with the variability becoming greater as the weather becomes increasingly erratic.’ The researchers conclude that, on aggregate, we will see an increasingly negative impact of climate change on crop yields from the 2030s onward. The impact will be greatest in the second half of the century, when decreases of more than 25 percent will become increasingly common.” (ASU News 2014, “New research shows climate change will reduce crop yields sooner than expected,” ASU News, March 25, 2014 announcing findings in Nature Climate Change 2014, Andy Challinor, Netra Chhetri et al, “A meta-analysis of crop yield under climate change and adaptation,” Nature Climate Change, doi: 10.1038/nclimate2153, March 16, 2014)
Greenhouse Gas Emissions Projections
China Greenhouse
Gas Emissions Underestimates. China may have under-reported its annual
carbon emissions by as much as 1.4 billion tonnes a year. “According to a new paper [The gigatonne gap in China’s carbon dioxide inventories] published in the journal Nature Climate Change,
China may be under-reporting its annual carbon emissions by as much as
1.4 billion tonnes a year—roughly the amount that Japan, the world’s
fourth-largest emitter of carbon dioxide (CO2), pumps out each year.
China is the world’s largest CO2 emitter and produces around a quarter of global carbon emissions.
But
according to the new study, which used more than a decade of official
Chinese data, China’s carbon emissions could be 20% higher than
previously thought. It says the emission discrepancy in 2010 is
equivalent to about 5% of the total global output (in 2008). The
authors, a team of scientists from China, Britain and America, found
that when comparing national and provincial statistics between 1997 and
2010 a startling gap appeared. National-level statistics from the period
reported a roughly 7.5% annual increase in emissions, to 7.69 billion
tonnes in 2010.
Data released by [China's local] provincial-level statistics offices and compiled by the group [led by Dabo Guan,
based at the University of Leeds in Britain] showed that the increase
could be nearer 8.5%.” (“Warmed-up numbers - China may be severely
under-reporting its carbon emissions,” The Economist, Beijing, China, June 23, 2012 reporting findings in Guan et al 2012, Dabo Guan, Zhu Liu, Yong Geng, Sören Lindner, & Klaus Hubacek, “The gigatonne gap in China’s carbon dioxide inventories,” Nature Climate Change, doi:10.1038/nclimate1560, June 10, 2012)
China's Emissions Gaps
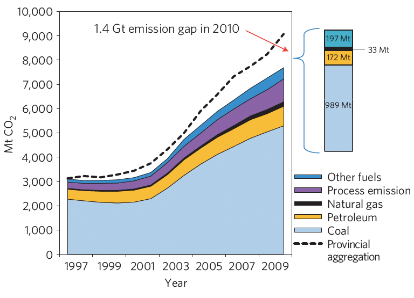
Sources of China’s CO2 emissions gap by fuel type during 1997–2010. Nature Climate Change, June 2012
___________________________________________________
"It is hard enough to reduce the emissions in any case, but now we [are] saying [after analyzing carbon dioxide emissions from melting permafrost] that we have to reduce [greenhouse gas emissions] even more." (9)
— Dr. Kevin Schaefer
National Snow and Ice Data Center
May 30, 2011
___________________________________________________
Carbon emissions
are worse than expected because scientists incorrectly assumed that
nations like China and India would choose to build cleaner low carbon
emissions power plants instead of less expensive higher carbon emissions
power plants. “[C]arbon emissions are not only still growing,
they're growing faster than ever, and the outcome is even worse than
scientists expected. That's mainly because the scientific models
underestimated the amount of carbon gas the world would be producing by
now. . . . So why did the scientists guess wrong?...
2010 Greenhouse gas emissions are higher than the worst case scenario forecast by the IPCC. “The global output of heat-trapping carbon dioxide jumped by the biggest amount on record, the U.S. Department of Energy calculated, a sign of how feeble the world's efforts are at slowing man-made global warming. The new figures for 2010 mean that levels of greenhouse gases are higher than the worst case scenario outlined by [Intergovernmental Panel on Climate Change] climate experts just four years ago [2007]. . . . . [Tom Boden, director of the Energy Department's Carbon Dioxide Information Analysis Center at Oak Ridge National Lab] said the latest figures put global emissions higher than the worst case projections from the climate panel. Those forecast global temperatures rising between 4 and 11 degrees Fahrenheit by the end of the century with the best estimate at 7.5 degrees.” (Seth Borenstein, Associated Press, “Biggest Jump Ever in Global Warming Gases,” Time Magazine, Thursday, November 3, 2011)
IPCC greenhouse gas emissions projections did not include contributions from outgassing permafrost melting. “Summer
sea ice [in the Arctic] has melted back to record minimums, average
temperatures have increased dramatically, and scientists have documented
significant melting of the underground permafrost, from Alaska to
eastern Siberia. The rising temperatures [in the Arctic] have
lengthened the growing season of the Arctic summer, which has increased
plant growth and the consequent uptake of carbon dioxide. However, by
around 2025 this will go into reverse and the thawing permafrost will
release more carbon than is being taken up by the tundra growing above
it, [Dr. Kevin Schaefer of the U.S. National Snow and Ice Data Center in Boulder, Colorado] said.
‘There are two important messages from this study.
The first is that the melting permafrost can release huge amounts of
carbon and, secondly, the process is irreversible on a human timescale
and will affect our targets for reducing fossil fuel emissions,’ he
said.
2020. Original target year (since revised from 2020 to the year 2009) China was predicted to surpass the U.S. in carbon dioxide global warming emissions. “Last November [2006], the International Energy Agency in Paris predicted that China would pass the United States in emissions of carbon dioxide in 2009. China had been expected to surpass the United States as late as 2020, but its soaring consumption of coal has rapidly increased the country’s emissions. China derives nearly 70 percent of its energy from coal-fired power plants, many of them equipped with substandard pollution controls. Chinese officials have long noted that China’s per capita emissions remain well below the averages in wealthier countries, including the United States. Officials also argue that China remains a developing country without the financial resources or technological prowess to make a rapid shift to cleaner, more expensive energy technology.” [Emphasis added] (Jim Yardley, “China Says Rich Countries Should Take Lead on Global Warming,” The New York Times, February 7, 2007)
2007 worst case scenario forecast of 2 ppm annual increase in CO2 levels already exceeded in 2008 by a 2.5 ppm annual increase. "“[A study by Andrew Brierley of St Andrews University] and his co-author, Michael Kingsford of the James Cook University in Australia, examined the effect of carbon dioxide emissions on ocean habitats and marine organisms. The scientists compared current carbon dioxide emissions with those forecast in 2007 by the Intergovernmental Panel [on] Climate Change (IPCC), the leading body for the assessment of global warming, which was established by the United Nations Environment Programme and the World Meteorological Organisation.
In
2007, the IPCC predicted a ‘worst-case scenario’ that would see rapid
industrialisation cause carbon dioxide in the atmosphere to increase by
two parts per million each year. Parts per million (ppm) is a unit of
concentration used to measure pollutants. Brierley said atmospheric
carbon dioxide concentration had increased from pre-industrial levels of 280 ppm to 385 ppm last year [2008] and was now rising at a rate of 2.5 ppm per year...
[In]
2007 [the IPCC] made a series of forecasts and if you take the
worst-case scenario, carbon dioxide would be going up by two parts per
million [worst-case scenario of 2 ppm annual increase in CO2].
‘This
really august body, the Intergovernmental Panel on Climate Change, has
said these are the worst-case scenarios for carbon dioxide increase and
we are above that already. That's the thing that really frightens me.’
Shale Gas, Methane Leaks and Global Warming
Current climate change forecasts
underestimate projected impacts because they do
not include greenhouse gas contributions from methane leaks into the atmosphere arising from hydraulic 'fracking" of shale gas drilling operations.
Methane is the principal component of natural
gas. Because the natural gas delivered by public utilities to the bulk
of end-use consumers is almost pure methane, the two terms are sometimes
used interchangeably. Methane’s global warming potential (GWP)
presents a much greater near-term climate disruption risk than carbon
dioxide (CO2). Averaged over a 20 year period, methane traps 72 times
more heat than CO2. (15) Over a 100-year time horizon, methane traps 25
times more heat than CO2. (16)
According to a Cornell University study published in the journal
Climatic Change, “3.6% to 7.9% of the methane from shale-gas production
escapes to the atmosphere in venting and leaks over the life-time of a
well. These methane emissions are at least 30% more than and perhaps
more than twice as great as those from conventional gas. The higher
[methane] emissions from shale gas occur at the time wells are hydraulically
fractured ['fracking'] —as methane escapes from flow-back return fluids—and during
drill out following the fracturing."
"Methane is a powerful greenhouse
gas, with a global warming potential that is far greater than that of
carbon dioxide, particularly over the time horizon of the first few
decades following emission. Methane contributes substantially to the
greenhouse gas footprint of shale gas on shorter time scales, dominating
it on a 20-year time horizon. The footprint for shale gas is greater
than that for conventional gas or oil when viewed on any time horizon,
but particularly so over 20 years. Compared to coal, the footprint of
shale gas is at least 20% greater and perhaps more than twice as great
on the 20-year horizon and is comparable when compared over 100 years.” (17)
Because of 1) methane’s greater climate disruption risks, 2) concerns
about leaking fugitive methane emissions from conventional natural gas
and shale gas ‘fracking’ operations and 3) because industry and
government analysts are forecasting a dramatic scale-up of natural gas
production driven by unprecedented expansion of shale gas hydraulic
fracturing operations, scientists are concerned that a transition to a natural gas-dominated energy
supply base, may actually accelerate global warming. The U.S. Energy
Information Administration has forecast a nearly four-fold increase in
shale gas production to 26.3 trillion cubic feet (tcf) in 2035 from 12.2 tcf in
2009. (18) Total shale gas resources added to existing global natural gas
resources increases total world technically recoverable resources to
over 22,000 trillion cubic feet. (19)
Expanding Fracking Natural Gas Production Produces
Increases in Methane Greenhouse Gas Emissions
Watch the video above with the accompanying PowerPoint presentation about emissions of greenhouse gases from fracking and conventional natural gas drilling operations. Source: Robert W. Howarth, Renee Santoro and Anthony Ingraffea, Developing Natural Gas in the Marcellus and other Shale Formations is likely to Aggravate Global Warming, Department of Ecology & Evolutionary Biology and School of Civil and Environmental Engineering, Cornell University, Ithaca, New York, March 15, 2011
How does methane compare to carbon dioxide in terms of global warming potential? Heat trapping potential?
U.S. Shale Gas & Natural Gas Production Forecast

Trillions of cubic feet per year, U.S. natural gas production, 1990-2035. EIA, Annual Energy Outlook 2011, U.S. Energy Information Administration, U.S. Department of Energy, Washington, DC, April 26, 2011, p. 3
Methane from Freshwater Lakes, Rivers and Dams
Methane emissions from lakes and rivers have been underestimated in climate change forecasts. “The amount of methane gas naturally released from lakes and rivers has been underestimated in scientists’ predictions about climate change, a recent study finds. An international team of scientists, which includes John Downing, an Iowa State University professor in the ecology, evolution and organismal biology department, has found greenhouse gas uptake by land environments such as forests is less than previously thought because of methane emissions from freshwater areas. Methane is considered a greenhouse gas. The study, [“Freshwater Methane Emissions Offset the Continental Carbon Sink”], published in the journal Science, finds methane gas release from freshwater areas changes the net absorption of greenhouse gases by natural land environments by at least 25 percent.
Before, estimates of carbon and greenhouse gas exchanges on continents did not account for the methane gas that is produced by lakes and running water. Downing compared the discovery to finding a large error in a financial budget. ‘This is really a pretty big error,” he said. “Imagine being off 25 percent in your accounting. It could sink your budget.’ In the same way, Downing said, the study reveals that an underestimation in the amount of methane gas released by freshwater bodies may have made previous estimates about the rate of climate change inaccurate.” (Laura Millsaps, Staff Writer, lmillsaps@amestrib.com, 515-663-6922, “Research: Methane gas underestimated in climate change,” The Tribune, Ames, Iowa, Saturday, January 22, 2011 reporting findings in David Bastviken, Lars J. Tranvik, John A. Downing, Patrick M. Crill and Alex Enrich-Prast, Freshwater Methane Emissions Offset the Continental Carbon Sink, Science, Vol. 331 no. 6013, DOI: 10.1126/science.1196808, January 7, 2011, p. 50)
__________________________________________________
This is really a pretty big error. Imagine being off 25 percent in your accounting. It could sink your budget. In the same way . . . an underestimation in the amount of methane gas released by freshwater bodies may have made previous estimates about the rate of climate change inaccurate. (12)
Iowa State University
On findings that methane gas emissions from
freshwater areas change the net absorption
of greenhouse gases by natural land
environments by at least 25 percent.
January 22, 2011
__________________________________________________
Methane is the world’s real problem for greenhouse gas emissions. (13)
— Mickey Fulp
Resource Investment Analyst
July 15,
2011
___________________________________________________
Methane gas discharges from dam reservoirs have been overlooked as a contributing source to climate change. Although it has been known that rising and falling water levels in dam reservoirs increase biological activity which in turn releases methane (a greenhouse gas) into the atmosphere, ‘their role in greenhouse gas emissions has been overlooked,’ points out Bridget Deemer, a doctoral student at Washington State University-Vancouver. (20)
Deemer and another Washington State researcher, Maria Glavin measured 20-fold and 36-fold increases in methane emissions during water reservoir level drawdowns in water column and lake mud samples, respectively. Methane is a much more potent greenhouse gas than carbon dioxide (CO2). Over a 20-year period, the emission of one ton of methane has the same climatic heat trapping impact as the emission of 72 tons of CO2. The Deemer/Glavin research is the first study to demonstrate and quantify the relationship between fluctuating water levels in dams and reservoirs and greenhouse gas releases. (20)
While the volume of methane emissions produced worldwide from dam reservoir drawdowns has yet to be quantified, these findings imply that the classification of hydroelectric dams as a ‘carbon neutral’ electric power source will need to re-addressed. The findings also raise questions about reservoir water fluctuation norms and how they will be impacted by the up and down volatility of increased flooding, more prevalent droughts, falling water tables, more frequent heat waves, higher levels of rainfall, expanding wild fire areas, sea level storm surges, melting permafrost, and other extreme weather events that are predicted in climate change forecast models. There are approximately 80,000 dams in the U.S., according to data published in the National Inventory of Dams (see map below) published by the U.S. Army Corps of Engineers.
Locations of U.S. Dams - Dams as a source of methane
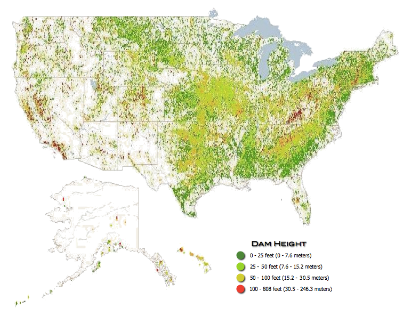
87% of the 84,134 dams in the U.S. are earth dams. 34% are recreation dams. 16% are dams dedicated to flood control. 15% of are used for fire protection. 9% are irrigation dams. 8% are dams dedicated to water supply. 3% are hydroelectric dams. Source: Adapted from U.S. Army Corps of Engineers, The National Inventory of Dams, 2010. Watch time lapse video of a dam draw down.
Temperatures and Global Warming
IPCC temperature projections found to be too conservative as current actual temperatures are now tracking worst case scenarios. “The climate science is getting more dismal at the same time this [decline in photovoltaic costs and growth in electric vehicle sales] is happening. We've seen the IPCC projections are now ground truthed against real world change, and we see that we're tracking the worst case scenario, which is 6° of warming . . . for the early part of the curve. . . . [I]n 2001, the IPCC produced these projections [See Climate Change 2001: IPCC Third Assessment Report] and they indicated that if we double CO2 above pre-industrial levels there's a 60% chance that the result will be a 2° or 3° rise in temperature, a 10% chance of a 1° rise and 10% chance of a 6° rise.
Because those projections were done ten years ago, scientists are now going back and looking at the real world data and [asking], were the projections right or not? It turns out that they were wrong. They were too conservative, at least for the early part of the projection curve. We're seeing the worst case scenario unfold.” IPCC temperature predictions vs actual. (Robyn Williams Interview with Tim Flannery, “Tim Flannery - Reasons to be hopeful,” ABC Radio National – The Science Show, January 1, 2011) Listen to this interview with scientist Tim Flannery. Watch videos of Tim Flannery.
___________________________________________________
I did not expect to see anything [in temperature increases] this large within the next three decades [2010 – 2039]. This was definitely a surprise. . . .
[Our] results suggest that limiting global warming to 2 degrees C does not guarantee that there won't be damaging impacts from climate change. (7)
Climate scientist
Stanford University, Aug. 2010
___________________________________________________
The widely used maximum 2 degrees C temperature increase target accepted by many scientists and policymakers may be insufficient to avoid dangerous climate change. “[In their 2010 study Intensification of hot extremes in the United States, climate scientists [Noah Diffenbaugh, an assistant professor of environmental Earth system science at Stanford and Moetasim Ashfaq, a former Stanford postdoctoral fellow now at the Oak Ridge National Laboratory] used two dozen climate models to project what could happen in the United States if increased carbon dioxide emissions raised the Earth's temperature by 1.8 degrees Fahrenheit (1 degree Celsius) between 2010 and 2039 – a likely scenario, according to the International Panel on Climate Change. In that scenario, the mean global temperature in 30 years would be about 3.6 F (2 C) hotter than in the pre-industrial era of the 1850s.
Many climate scientists and policymakers have targeted a 2 C temperature increase as the maximum threshold beyond which the planet is likely to experience serious environmental damage. For example, in the 2009 Copenhagen Climate Accord, the United States and more than 100 other countries agreed to consider action to reduce greenhouse gas emissions ‘so as to hold the increase in global temperature below 2 degrees Celsius.’ But that target may be too high to avoid dangerous climate change, Diffenbaugh said, noting that millions of Americans could see a sharp rise in the number of extreme temperature events before 2039, when the 2-degree threshold is expected to be reached.
‘Our results suggest that limiting global warming to 2 degrees C above preindustrial conditions may not be sufficient to avoid serious increases in severely hot conditions,’ Diffenbaugh said. . . . ‘Frankly, I was expecting that we'd see large temperature increases later this century with higher greenhouse gas levels and global warming,’ Diffenbaugh said. ‘I did not expect to see anything this large within the next three decades. This was definitely a surprise.’ . . . [Many of the intense heat wave] climate change impacts [forecast using the Stanford climate models] could occur within the next two decades [2010-2030] - years before the planet is likely to reach the 2-degree C threshold targeted by some governments and climate experts, [Diffenbaugh] added.
‘It's up to the policymakers to decide the most appropriate action,’ Diffenbaugh said. ‘But our results suggest that limiting global warming to 2 degrees C does not guarantee that there won't be damaging impacts from climate change.’” (Mark Shwartz, communications manager, Woods Institute for the Environment at Stanford University, “Heat waves and extremely high temperatures could be commonplace in the U.S. by 2039, Stanford study finds,” Stanford Report, July 8, 2010 citing findings in Diffenbaugh, N., and M. Ashfaq. Intensification of hot extremes in the United States. Geophys. Res. Lett., (in press) DOI: 10.1029/2010GL043888, August 6, 2010) This study does not take into account the contributions to total greenhouse gas emissions from methane released from melting permafrost and thermokarst erosion.
Earth is warming faster than previously predicted. “The U.N. Intergovernmental Panel on Climate Change [IPCC] warns that the planet is warming faster than previously predicted. The Nobel Prize winning group of scientists says carbon and other heat-trapping greenhouse gas emissions must stabilize by 2015 and then decline to head off the worst consequences from climate change.” (Lisa Schlein, “VOA News: U.S. Wants More Balanced Approach To Climate Change,” Voice of America, US Fed News Service, Including US State News, November 27, 2007)
___________________________________________________
The message on the science is that we know a lot more than we did in 1997 [when the Kyoto Protocol climate agreement was signed] and it's all negative.
Things are much worse than the models predicted. (8)
Pew Center on Global Climate Change
November 23, 2009
___________________________________________________
[The impacts of climate change] ‘seem to be occurring faster than we projected just five or 10 years ago.
We're seeing things happening now [2008] that we didn't think would happen before 2030 or 2040. (2)
National Center for Atmospheric Research
Boulder, Colorado, May 2008
___________________________________________________
Rate of Global Warming Significantly Underestimated
___________________________________________________
None of this has been taken into account by politicians and policy makers looking to cut humanity's carbon emissions with the agreed on target of keeping global temperatures below two degrees C. (11)
— Stephen Leahy, IPS, February 15, 2011
Reporting on discoveries of new sources
of greenhouse gases emitted from melting
Arctic permafrost, methane hydrates
escaping from melting undersea permafrost
and
thermokarst erosion.
___________________________________________________
Fires and Global Warming
Climate change forecasting models have not incorporated the link between fire and global warming. “Massive wildfires
that have become increasingly common in recent years are a flash point
for climate change, which in turn will spark additional devastating
fires, research [published in in the journal Science]
released today [April 24, 2009] indicates. The investigation, led in
part by a [University of Arizona] professor, suggests that the Earth is
caught in a damaging feedback loop: Wildfires emit huge amounts of
carbon dioxide, increasing the rate of global warming. That warming then
increases the number and severity of wildfires.
It's a thought
that should concern scientists studying climate change, as forecasting
models haven't incorporated the link between fire and global warming,
said Thomas Swetnam, director of the University of Arizona's Laboratory of Tree-Ring Research.
‘The biggest concern I have is that it is possible that we are
underestimating the positive feedback of fire to the climate system and
affecting future climate,’ said Swetnam, a co-author on the study. ‘We
may be underestimating how much carbon future fires will contribute to
the atmosphere.’” (Aaron Mackey, Arizona Daily Star staff, “Fires: new
climate threat?,” The Arizona Daily Star, Tucson, Arizona, April 24, 2009, p. A1 reporting findings in Bowman, Swetnam, et al, “Fire in the Earth System,” Science 24 April 2009: 481-484.DOI:10.1126/science.1163886)
See a more comprehensive summary of global warming fire forecasts.
Permafrost Melting and Global Warming
Current climate change forecasts underestimate the projected impacts of greenhouse gases because they do not include methane that will be released from melting permafrost and thermokarst erosion.
“[The first study to quantify when and how much carbon will be released from thawing permafrost was published online on February 15, 2011 in the meteorological journal Tellus. According to study co-author Kevin Schaefer, a scientist at the National Snow and Ice Data Center (NSIDC) in Boulder, Colorado], ‘The amount of carbon [projected to be released from melting permafrost] is equivalent to half the amount of carbon that has been released into the atmosphere since the dawn of the industrial age,’ The additional carbon from permafrost would increase the average temperatures in the Arctic by eight to 10 degrees C, the study reported. Not only would this utterly transform the Arctic, it would also increase the planet's average temperature by about three degrees C, agrees Schaefer.
...As catastrophic as all this is, Schaefer acknowledges his study underestimates what is likely to happen. The model does not measure methane releases, which are 40 times as potent in terms of warming as carbon. Methane could have a big impact on temperatures in the short term, he says. ‘There would be a lot of methane emissions. We're working on estimating those right now,’ he said. The model also does not include emissions from the large region of underwater permafrost. IPS [Inter Press Service] previously reported that an estimated eight million tonnes of methane emissions are bubbling to the surface from the shallow East Siberian Arctic shelf every year.
If just one percent of the Arctic undersea methane (also called methane hydrates) reaches the atmosphere, it could quadruple the amount of methane currently in the atmosphere, Vladimir Romanovsky of the University of Alaska in Fairbanks previously told IPS. Nor does the model account for a process called thermokarst erosion, acknowledges Schaefer. This is a widely observed process where meltwater erodes the permafrost and exposes it to warmer temperatures and speeding up the thaw. ‘We can't model that yet but it could contribute to major releases of carbon and methane,’ he said. None of this has been taken into account by politicians and policy makers looking to cut humanity's carbon emissions with the agreed on target of keeping global temperatures below two degrees C.” (Stephen Leahy, “Permafrost Melt Soon Irreversible Without Major Fossil Fuel Cuts,” Inter Press Service, Uxbridge, Canada, February 17, 2011 reporting findings in Kevin Schaefer, Tingjun Zhang, Lori Bruhwiler, Andrew P. Barrett, "Amount and timing of permafrost carbon release in response to climate warming," Tellus B, 2011; DOI: 10.1111/j.1600-0889.2011. 00527.x, article first published online on February 15, 2011)
See a more comprehensive summary of permafrost melt forecasts.
___________________________________________________
[A]wareness of methane leaks from permafrost is so new that it was not even mentioned in the seminal 2007 report by the Intergovernmental Panel on Climate Change. (10)
— Arthur Max, Bureau Chief
Associated Press, The Netherlands
November 2010
___________________________________________________
______________________________________________________
We cannot afford to underestimate this problem. If we face irreversible and catastrophic consequences, we must act, and we must act decisively. (6)
Kleiner Perkins
______________________________________________________
Disease and Global Warming
2006. Events forecast to occur in 2080 are occurring in 2006. “Scientists have warned for more than a decade that climate change would broaden the range of many diseases. But the warnings were couched in the future, and qualified. The spread of disease is affected by many uncertainties, including unforeseen resistance to antibiotics, failures of public health systems, population movement and yearly climate swings. For that reason, some scientists have been cautious about the link between disease and global warming."
"But Paul Epstein, a physician who worked in Africa and [at the time this article was published was] on the faculty of Harvard Medical School, said that, if anything, scientists weren't worried enough about the problem. ‘Things we projected to occur in 2080 are happening in 2006. What we didn't get is how fast and how big it is, and the degree to which the biological systems would respond,’ Epstein said in an interview in Boston. ‘Our mistake was in underestimation.’” Climate change predictions that have not happened. (Doug Struck, Washington Post Foreign Service “Climate Change Drives Disease To New Territory - Viruses Moving North to Areas Unprepared for Them, Experts Say,” The Washington Post, Washington, D.C., May 5, 2006, p. A16)
Ice Free Arctic | Arctic Melting Global Warming
Ice free Arctic forecasts revised to nearer term event instead of previous projections for 2050 and 2070. “Recent satellite data from the U.S. Space agency NASA indicate that sea ice in the Arctic and Greenland is melting at a faster rate than previously projected. VOA's Paul Sisco has the story. Climate scientists at NASA's Goddard Space Flight Center in Greenbelt, Maryland, outside Washington, say the Arctic Ocean could be mostly ice free in late summer 2013.
‘The sea ice is decreasing faster than all the models predicted," says Jay Zwally, the ice satellite project scientist at NASA Goddard, ‘We not only have the warming of the atmosphere, we have a warming of the ocean that is affecting this. It has been surprising to everybody, this decrease in [Arctic sea ice] area. This is a marked departure, and this is suggesting to us that maybe we are getting at this tipping point.’” (No author credited, “NASA Scientists See Hastened Arctic Warming,” Voice of America, Washington, DC, January 9, 2008)
See the chronology of ice free Arctic global warming forecasts over time.
_____________________________________________________
It's always dangerous to make predictions, but we are right on schedule’ for [the disappearance in 2070 of summer Arctic sea ice] to occur.” (3)
— Mark Serreze,
Senior research scientist
National Snow and Ice Data Center
Boulder, Colorado, March 2006
____________________________________________________
Models
predicting
the rate of Arctic sea ice melting underestimated by a factor of 3.
“Arctic Ocean sea ice is melting faster than even the most advanced
climate change models predict, a new study [Arctic
Sea Ice Decline: Faster Than Forecast] concludes. The work, published today [May 1, 2007] in
the journal Geophysical
Research Letters, used the
models to retroactively predict sea-ice decline from 1953 to 2006.
Scientists then compared the results to what has actually been recorded
by Earth-based and satellite observations during that time frame.
The
team found that, on average, 18 climate models used in a 2007
report by the Intergovernmental Panel on Climate Change (IPCC)
underestimated the extent of sea-ice decline by a factor of three.
‘We're about 30 years ahead of what the models show,’ said Julienne Stroeve,
lead author of the study and a researcher at the National Snow and Ice Data Center (NSIDC)
at the University
of Colorado in Boulder. The IPCC report projects that the Arctic
Ocean will retain some ice year-round until about 2050, after which time
the region will be ice-free during the summers. . .
But the new
findings mean that the ocean could lose its summer sea ice much sooner,
Stroeve said. . . . Study author Stroeve believes that the models
underestimate the effect of ocean currents carrying ever warmer water
into the Arctic Ocean from the Atlantic and Pacific. ‘The models don't
handle ocean processes quite so well,’ she said. ‘This is playing a
larger role than we thought.’ Still, she added, all the models make it
clear that human-caused emissions of carbon dioxide and other
atmosphere-warming gases are a major factor in Arctic melting. ‘It is
highly unlikely that this is natural variability,’ she said. ‘I believe
this is happening because of changes in our atmosphere’ caused by human
activities.”
(Richard A. Lovett, “Arctic Ice Melting Much
Faster Than Predicted, National
Geographic News, May 1, 2007 citing findings from Stroeve, J., M. M. Holland, W. Meier, T. Scambos, and M. Serreze
(2007), Arctic
sea ice decline: Faster than forecast, Geophys. Res. Lett., 34,
L09501, doi:10.1029/2007GL029703, May 1, 2007) Follow NSIDC on
Twitter for the latest Arctic sea ice
developments.
See additional Arctic predictions.
___________________________________________________
[The IPCC] report from 2007 doesn't include any results published later than 2005. (4)
Marine Scientist, Univ. of Copenhagen
Copenhagen, Norway
___________________________________________________
2070. Computer
model projections that the Arctic won't be entirely ice-free until 2070 may be based on underestimates that are overly optimistic.
“Current computer models suggest that the Arctic will be entirely
ice-free during summer by the year 2070 but some scientists now believe
that even this dire prediction may be over-optimistic, said Professor Peter Wadhams,
an Arctic ice specialist at Cambridge
University. ‘When the ice becomes so thin it breaks up
mechanically rather than thermodynamically. So these predictions may
well be on the over-optimistic side,’ he said. As the sea ice melts,
and more of the sun's energy is absorbed by the exposed ocean, a
positive feedback is created leading to the loss of yet more ice,
Professor Wadhams said.
‘If anything we may be underestimating
the dangers. The computer models may not take into account collaborative
positive feedback,’ he said. Sea ice keeps a cap on frigid water,
keeping it cold and protecting it from heating up. Losing the sea ice of
the Arctic is likely to have major repercussions for the climate, he
said. "There could be dramatic changes to the climate of the northern
region due to the creation of a vast expanse of open water where there
was once effectively land," Professor Wadhams said. ‘You're essentially
changing land into ocean and the creation of a huge area of open ocean
where there was once land will have a very big impact on other climate
parameters,’ he said.” (Steve Connor, Science Editor, “Global warming
'past the point of no return',” The Independent, Friday, 16 September 2005)
___________________________________________________
— Julienne Stroeve
National Snow and Ice Data Center
On the rate of Arctic ice melting
___________________________________________________
Glaciers Melting and Global Warming
2009-2010. 2020. The Bolivian Chacaltaya glacier forecast to disappear in 2020 disappeared in 2009-2010. “The glaciers that ring the [Bolivian] cities [of La Paz and El Alto] have essentially provided natural low-maintenance storage, collecting water in the short rainy season and releasing it for water and electricity in the long dry one. With warmer temperatures and changing rainfall, they no longer do so. ‘The effects are appearing much more rapidly than we can respond to them, and a reservoir takes five to seven years to build. I’m not sure we have that long,’ said Edson Ramírez, a Bolivian glaciologist who has documented and projected the glaciers’ retreat for two decades. The retreat has outpaced his wildest predictions. He had predicted that one glacier, Chacaltaya, would last until 2020. It disappeared this year. In 2006, he said El Alto water demand would outstrip supply by 2009. It happened.” (Elisabeth Rosenthal, “In Bolivia, Water and Ice Tell of Climate Change,” The New York Times, December 14, 2009)
Rising Sea Levels
Global sea levels are rising 10 times faster than IPCC estimates. “A recent report from the Intergovernmental Panel on Climate Change
-- known as the IPCC -- estimated that during all of the past century
worldwide melting ice from global warming had raised sea levels by only
two-tenths of a millimeter a year, or about 20 inches for the entire
century. But, according to [physicist Jianli Chen]
and his Texas team, the melting of Greenland's ice cap is already
raising global sea levels by six-tenths of a millimeter each year, and
the Colorado group [University of Colorado physicists Isabella Velicogna and John Wahr]
estimates that melting of the West Antarctic Ice Sheet alone is adding
up to four-tenths of a millimeter of fresh water to sea levels each
year.
In other words, the global sea level, due to melting of the ice
in Greenland and Antarctica combined, is already rising 10 times faster
than the IPPC's tentative estimates, the two analyses indicate. (David Perlman, Chronicle Science Editor, Greenland's ice cap is melting at a frighteningly fast rate,” San Francisco Chronicle, San Francisco, California, Friday, August 11, 2006 reporting findings in Satellite Gravity Measurements Confirm Accelerated Melting of Greenland Ice Sheet, August 2006 and Measurements of Time-Variable Gravity Show Mass Loss in Antarctica, March 2006)
Rising Sea Levels Underestimated by Climate Models

IPCC (best estimate) sea level rise forecasts compared to actual sea level data measured by orbiting satellites. The chart above (click to enlarge for greater detail) shows the actual sea level rise record compared with the IPCC’s ‘Best Estimate” predictions about how sea levels were projected to change over time. Satellite data show that ocean levels are rising faster than anticipated. As Energy Secretary Steven Chu noted, climate scientists “didn’t get it right.” They “underestimated how fast the sea level was rising.”
IPCC sea level rise forecasts failed to include melting of Greenland and West Antarctic ice sheets. “[M]ost climate scientists now believe that the main drivers of sea level rise in the 21st century will be the melting of the West Antarctic Ice Sheet (a potential of a 16-foot rise if the entire sheet melts) and the Greenland Ice Sheet (a potential rise of 20 feet if the entire ice cap melts). . . . The reports from the Intergovernmental Panel on Climate Change (IPCC) are balanced and comprehensive documents summarizing the impact of global warming on the planet.
But they are not without imperfections, and one of the most notable was the analysis of future sea level rise contained in the latest report, issued in 2007 [see Table on p. 8 of report]. Given the complexities of forecasting how much the melting of the Greenland and West Antarctic ice sheets will contribute to increases in global sea level, the IPCC chose not to include these giant ice masses in their calculations, thus ignoring what is likely to be the most important source of sea level rise in the 21st century. Arguing that too little was understood about ice sheet collapse to construct a mathematical model upon which even a rough estimate could be based, the IPCC came up with sea level predictions using thermal expansion of the oceans and melting of mountain glaciers outside the poles.
Its results were predictably conservative — a maximum of a two-foot rise this century [2100] — and were even a foot lower than an earlier IPCC report that factored in some melting of Greenland’s ice sheet. The IPCC’s 2007 sea level calculations — widely recognized by the academic community as a critical flaw in the report — have caused confusion among many in the general public and the media and have created fodder for global warming skeptics. But there should be no confusion about the serious threat posed by rising sea levels, especially as evidence has mounted in the past two years of the accelerated pace of melting of the Greenland and West Antarctic ice sheets.” (Rob Young and Orrin Pilkey, “How High Will Seas Rise? Get Ready for Seven Feet,” Yale Environment 360, January 14, 2010)
________________________________________________
(1) Warren Buffett quoting his mentor, Ben Graham, in an interview with Charlie Rose, “A Conversation With Warren Buffett, The Charlie Rose Show, July 10, 2006
(2) Peter Backlund of the National Center for Atmospheric Research in Boulder, Colorado quoted in Bill Scanlon, Rocky Mountain News, “Drier climate coming sooner, report says,” Rocky Mountain News, Denver, Colorado, May 28, 2008 reporting on findings in Peter Backlund, Anthony Janetos, and David Schimel and Margaret Walsh, The Effects of Climate Change on Agriculture, Land Resources, Water Resources and Biodiversity, Synthesis and Assessment Product 4.3, U.S. Climate Change Science Program, May 2008
(3) Mark Serreze,
senior research scientist, National
Snow and Ice Data Center, University of Colorado, Boulder quoted in
Adrianne Appel, “Arctic Ice Isn't Refreezing in the Winter, Satellites
Show,” National Geographic News, March 17, 2006
(4) Olive Heffernan, "Interview: Katherine Richardson," Nature Reports, Nature Publishing Group, London, England, March 5, 2009
(5) Richard A. Lovett, “Arctic Ice Melting Much Faster Than Predicted, National Geographic News, May 1, 2007 reporting on findings from Stroeve, J., M. M. Holland, W. Meier, T. Scambos, and M. Serreze (2007), Arctic sea ice decline: Faster than forecast, Geophys. Res. Lett., 34, L09501, doi:10.1029/2007GL029703, May 1, 2007) Follow NSIDC on Twitter for the latest Arctic sea ice developments.
(6) John Doerr, “John Doerr sees salvation and profit in greentech,”
TEDTalks, TED2007, Monterey, California, March 2007
(7) Noah Diffenbaugh, assistant professor of environmental Earth system science at Stanford University quoted in Mark Shwartz, communications manager, Woods Institute for the Environment at Stanford University, “Heat waves and extremely high temperatures could be commonplace in the U.S. by 2039, Stanford study finds,” Stanford Report, July 8, 2010
(8) Eileen Claussen, president of the Pew Center on Global Climate Change,
quoted in Seth Borenstein, AP Science Writer, “Warming's impacts sped
up, worsened since Kyoto,” Associated Press, November 23, 2009
(9) Dr. Kevin Schaefer, kevin.schaefer@nsidc.org, National Snow and Ice Data Center quoted in press
release, “Thawing permafrost will accelerate global warming in decades
to come, says new study,” National Snow and Ice Data Center, Boulder,
Colorado, February 16, 2011
(10) Arthur Max, Associated Press bureau chief, The Netherlands, “Leaking Siberian Ice Raises a Tricky Climate Issue,” ABC News, Chersky, Russia, November 21, 2010
(11) Stephen Leahy, “Permafrost Melt Soon Irreversible Without Major Fossil
Fuel Cuts,” IPS, Uxbridge, Canada, February 17, 2011 reporting findings
in Kevin Schaefer, Tingjun Zhang, Lori Bruhwiler, Andrew P. Barrett, Amount and timing of permafrost carbon release in response to climate warming, Tellus B, 2011; DOI: 10.1111/j.1600-0889.2011.00527.x, article first published online on February 15, 2011
(12) Laura Millsaps, Staff Writer, lmillsaps@amestrib.com, 515-663-6922, “Research: Methane gas underestimated in climate change,” The Tribune, Ames, Iowa, Saturday, January 22, 2011 reporting findings in David Bastviken, Lars J. Tranvik, John A. Downing, Patrick M. Crill and Alex Enrich-Prast, Freshwater Methane Emissions Offset the Continental Carbon Sink, Science, Vol. 331 no. 6013, DOI: 10.1126/science.1196808, January 7, 2011, p. 50
(13) Mickey Fulp, Geologist, Resource Investment Analyst “What’s Up (Or Down)
with the Natural Gas Market?,” ResourceInvestor.com, Friday, July 15,
2011
(14) EIA, Annual Energy Outlook 2011, U.S. Energy Information Administration, U.S. Department of Energy, Washington, DC, April 26, 2011
(15) Intergovernmental Panel on Climate Change (IPCC), "Climate Change 2007: The Physical Science Basis - Summary for Policymakers," Fourth Assessment Report (FAR), Working Group 1 (WGI), Chapter 2, IPCC Secretariat, Geneva, Switzerland, February 2007, p. 212
(16) Nobel laureate Dr. Kirk R. Smith makes the case that greater concern should be paid to methane's near-term 20-year global warming potential (GWP) impact (72 times more heat trapping consequences than CO2) because focusing on the 100-year or 500-year GWP impacts of greenhouse gases like carbon dioxide "would result in spending most money to protect people thousands of years into the future and ignoring the needs of ourselves and our children." Kirk R. Smith, PhD, Nobel Laureate, "Carbon on Steroids, The Untold Story of Methane, Climate, and Health," PowerPoint presentation to the California Air Resources Board (CARB), Sacramento, California, November 10, 2008, Slide 18
(17) Robert W. Howarth, Renee Santoro and Anthony Ingraffea, Methane and the greenhouse-gas footprint of natural gas from shale formations, Climatic Change, Volume 106, Number 4, pp. 679-690, DOI: 10.1007/s10584-011-0061-5, published online April 12, 2011
(18) EIA, Annual Energy Outlook 2011, U.S. Energy Information Administration, U.S. Department of Energy, Washington, DC, April 26, 2011
(19) EIA, Shale gas is a global phenomenon, U.S. Energy Information Administration, Washington, D.C. April 5, 2011
(20) Washington State University, “New Global Warming Culprit: Methane Emissions Jump Dramatically During Dam Drawdowns,” ScienceDaily, August 8, 2012
2000 | 2010 | 2011 | 2012 | 2013 | 2014 | 2015 | 2020 | 2025 | 2030 | 2035 |2040 | 2050 | 2060 | 2070 | 2080 | 2085 | 2090 | 2100
Arctic Global Warming | Wildfires | Climate Change Cost | Kilimanjaro Melting | Heat Waves Global Warming | Energy Workforce Shortages
Global Warming Underestimated | China Global Warming | CO2 CH4 | Climate Refugees | Permafrost | Global Warming Sea Levels Rising
Sea Level Rise Maps | Global Warming Deaths | Water Shortages | Methane Carbon Dioxide
Recommend this page to Google +1
Don't forget to bookmark this page
Global
Warming Underestimated