Global Warming Forecasts | Climate Instability
Global warming forecasts trace their history back to the works of Swedish chemist Svante Arrhenius (1890s), American geologist Thomas Chamberlain (1890s) and British engineer Guy S. Callendar (1930s and '40s).
In the 1950s, after oceanographers Roger
Revelle and Hans
Suess published research findings concluding that "human beings are now carrying out a large-scale geophysical experiment" by discharging greenhouse gases into the atmosphere, Revelle, director of the Scripps Institution of Oceanography, recruited geochemist Charles David
Keeling to begin the process of taking long-term measurements of carbon dioxide (CO2) concentrations in the atmosphere.
When Keeling started taking CO2 measurements at the weather observatory at the top of the Mauna Loa volcano in Hawaii and on the continent of Antarctica, he established the baseline for collecting the data that would begin the modern era of global warming forecasting.
Since Revelle’s and Keeling’s landmark work in the 1950s, global warming forecast research has expanded to develop projections based on concentrations of other greenhouse gases such as methane (the principal component of natural gas), carbon monoxide and nitrous oxide as well as temperature data, precipitation, weather patterns and specific ecosystems.
Global warming forecasting and research formats, however, have tended to be linear or vertical in nature, i.e., focusing on observations of singular data sets over time such as:
- Carbon dioxide concentrations,
- Temperature trends,
- Wildfire frequency,
- Heat wave frequency,
- Water scarcity and water stress,
- Polar ice thickness,
- Permafrost melt rates,
- Arctic sea ice melt rates,
- Snowpack levels,
- Snow melt,
- Sea level rise rates, or
- Frequency and severity of floods and hurricanes.
Here and on the pages that follow is a look at global warming forecasts from a "confluence forecast" or "convergence forecast" perspective. Rather than the conventional vertical format, we look at multiple converging forecasts presented in a horizontal or more integrated "side-by-side" context.
Forecasts from 2015 to 2100 are juxtaposed to other same period forecasts to illuminate converging trajectories, potential colliding events, compounding multiple stress events, synergies as well as research, information gaps or gaps in the availability of remedial resources and assets.
For example:
- Disease rates, extreme weather events and heat wave forecasts presented alongside forecasts of skilled workforce availability and the capacity to meet demand for health, medical and first-responder emergency services.
- Projections of hospital and medical personnel shortages occurring concurrently with heat wave induced power outages and water shortages.
- Water demand strains from droughts occurring simultaneously with wildfire mobilization and suppression efforts that drain water from reservoirs dedicated to meeting fresh drinking water and agriculture requirements.
- Grid, energy and water infrastructure expansion forecasts juxtaposed to forecasts competing for the availability of sufficient-sized workforce resources for infrastructure construction, repair and maintenance.
- Food shortages alongside forecasts of feedstocks and raw materials for fertilizers necessary to meet food demands.
- Critical and raw materials availability forecasts overlaid on projections for clean technology markets and the greenhouse gas control technologies required to mitigate and adapt to climate change.
- Technology commercialization progress and market penetration forecasts juxtaposed to accelerating climate change impact forecasts.
IPCC 5th Assessment Report (AR5) Summary
Synthesis Report on Climate Change, Copenhagen
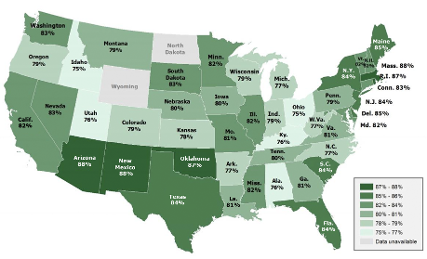
Percentage of Americans Who Believe
Global Warming Has Been Happening
Click to Enlarge. Source: Stanford Woods Institute for the Environment, Jon Krosnick and Bo MacInnis, Survey Analysis Contradicts Common Climate Perceptions - Has Global Warming Been Happening?, Stanford Geospatial Center, Stanford, California, November 13, 2013.
NASA Finds Sustained Long-Term Warming Trends
NASA Finds 2012 Sustained Long-Term Climate Warming Trend. NASA's analysis of Earth's surface temperature found that 2012 ranked as the ninth-warmest year since 1880. NASA scientists at the Goddard Institute for Space Studies (GISS) compare the average global temperature each year to the average from 1951 to 1980. This 30-year period provides a baseline from which to measure the warming Earth has experienced due to increasing atmospheric levels of heat-trapping greenhouse gases. While 2012 was the ninth-warmest year on record, all 10 of the warmest years in the GISS analysis have occurred since 1998, continuing a trend of temperatures well above the mid-20th century average. Source: NASA Goddard Institute for Space Studies.
NASA Computer Model Provides a New Portrait of Carbon Dioxide
2000 | 2010 | 2013 | 2015 | 2020 | 2025 | 2030 | 2035 |2040 | 2050 | 2060 | 2070 | 2080 | 2085 | 2090 | 2100
Heat Waves Global Warming | Energy Workforce Shortages | Water Shortages | Methane Carbon Dioxide | Arctic Global Warming | Wildfires | Climate Change Cost
Global Warming Underestimated | CO2 CH4 | Permafrost | Global Warming Sea Levels Rising | Sea Level Rise Maps | Global Warming Deaths
Melting Ice Caps | Kilimanjaro Melting | China Global Warming | Climate Refugees
Don't forget to bookmark this page
Global Warming Forecasts
